Introduction
The Growth-Share Matrix s a strategic business analysis tool, created by Boston Consulting Group in 1970, and popularly known as BCG Matrix. The Matrix provides a structured and user-friendly platform for analyzing a company’s multiple business units or as the parent company, holding numerous businesses, to categorize and evaluate growth and market share. The Matrix has proven to be effective in helping executive teams assess and make decisions in allocating resources, supporting a company’s product and service portfolio.
Harvard Business Review named the BCG Matrix one of the frameworks that changed the world!
Almost 50 years after the creation of the BCG Matrix, the original hypothesis is very much alive and accepted in corporate business and market analyses circles. Today’s executive cadre requires a simple and user-friendly tool to continually evaluate business unit product portfolios in a structured and systematic manner. The Growth-Share Matrix appears to be the analysis tool of choice!
The Matrix provides a two-dimensional view, including market growth rate and relative market share. Each dimension consists of two degrees – high and low.
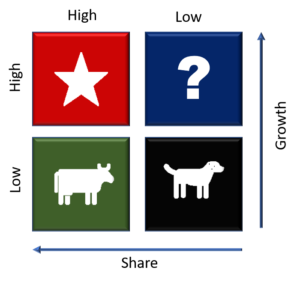
The Matrix classifies and displays corporate business units within four quadrants:
- Stars are company products sold in high growth markets with large company market share.
- Question Marks are company products sold in high growth markets with low company market share.
- Cash Cows are company products in low growth markets with high market share.
- Dogs are company products with low growth or market share in a mature or slow-growing market.
As an industry matures and growth slows, company business units typically evolve to either Cash Cows or Dogs. The natural cycle for business unit evolution is that they commence their life cycle as Question Marks, then progress to Stars. Ultimately, market growth stops; thus, the company business unit evolves into a Cash cow. At the end of the cycle, Cash Cows usually turn into Dogs.
“A market is never saturated with a good product, but it is very quickly saturated with a bad one.”
Henry Ford
The BCG Matrix is also used to analyze how a company may evaluate investments in various marketing channels. The research and analysis medium is different, but the strategy remains the same such as, milk the Cash Cows, don’t waste money on Dogs, invest in Stars and provide Question Marks the funds necessary to progress to Stars ultimately.
BCG Matrix: Components
To use the BCG Matrix, users plot a scatter graph to rank the company’s business units based on their relative market shares and growth rates. The two axes of the matrix are Market Share (or the ability to generate cash) and Growth (or the need for money).
Stars
This quadrant is characterized where a company business unit(s) has a high market share in a fast-growing industry.
Stars represent graduated Question Marks with a market- or niche-leading trajectory, for example: amongst market share front-runners in a high-growth sector, and having an unchallenged or increasingly dominant unique selling proposition with a burgeoning and fortuitous scheme. Stars usually require high funding to defeat key competitors and maintain their upward growth rate.
Stars potentially become Cash Cows if they can sustain their success until a time when the market growth rate declines.
Question Marks
This quadrant is characterized where a company’s business unit(s) is operating with a low market share in a high-growth market.
Question Marks are a starting point for most corporate business units. Question Marks have the potential to gain market share and become Stars, and eventually, Cash Cows when market growth slows. If Question Marks are unsuccessful, in becoming market leaders, they will degenerate into Dogs when market growth declines.
Question Marks should be analyzed carefully to determine the value of the investment.
Cash Cows
This quadrant is characterized where a company’s business unit(s) has high market share in a slow-growing industry.
Companies with business units identified as Cash Cows typically generate cash more than the amount of money needed to maintain the business. They are regarded as staid and boring, in a mature market, with businesses value due to their cash-generating qualities. Cash Cows should be milked incessantly with modest or no financial investment in an industry with low growth potential.
Companies are advised to invest in Cash Cows to maintain the current level of productivity, or to milk the gains passively.
Dogs
This quadrant is characterized where a company’s business unit(s) have a low market share in a mature, slow-growing market.
Companies with business units identified as Dogs typically operating around the break-even point and generate just enough (or less) cash to maintain the business’s market share. Though owning a break-even business unit provides the social benefit of providing employment and possible synergies that assist other business units, financially, such business units are considered worthless. Dogs generally depress a profitable businesses’ return on assets ratio (ROA).
Dogs are regularly viewed as cash traps since businesses have money tied up in them, even though the rate of return is non-existent.
“A brand for a company is like a reputation for a person. You earn reputation by trying to do hard things well.”
Jeff Bezos
Using the BCG Matrix in the Current Economy
Since the 1970s, the world’s economic foundations and structures have dramatically changed and impacted the business environment’s quest for market share and growth.
Fundamental changes that continual impact individual business market share and growth include:
- Businesses face challenges and demands that change more rapidly and unpredictably than ever before because of emerging technology and digital transformation, other factors. As a result, companies need to continually assess and renew their market advantage, increasing the speed at which they shift resources among products and business units.
- Market share is no longer a direct forecaster of sustained business performance. Today, disruptive technology and the ability to adapt or to shape market conditions represent reliable forecasters.
Growth Rate & Market Share Analysis: Considerations
Today, the business environment is dynamic and continually evolving and restructuring for markets, geographies, and individual market participants. These events are driving the corporate executive team’s mission-critical decision-making to take timely advantage of revenue and profitability opportunities and mitigate threats to their business.
Below are factors typically considered in conducting a growth rate and market share analysis.
Internal Factors
- Company leadership and employee caliber.
- Products and Services – attractiveness, positioning, and pricing (that meet customer needs and demands).
- Revenue and profitability.
- Customer satisfaction and loyalty. (long-term customer relationships)
- Emerging technologies – leverage, exploit, and monetize: embed and integrate product and service and business and support processing.
- Business processes optimization (high employee and unit productivity)
- Competitive advantages.
External Factors
- Competitive threats: current and new market entry participants.
- Market trends and directions for products and services, including consumer/buyer purchase behaviors.
- Regulatory and compliance requirements are impacting domestic and international business activities.
BCG Matrix: Benefits
The key benefits realized by the successful application of the BCG Matrix provide:
- The objective analysis not subject to interpretation.
- Help to create a strategic approach for investment and support of business units (or brands or products).
- Timely and appropriate strategic decision-making.
- The set-up of the strategic model has proved robust over time and significant changes in the competitive environment.
- The quantifiable basis to allocate resources to business units, based upon competitive position and market opportunity.
BCG Matrix Planning & Set-up
The BSG Matrix planning and set-up activities cover:
- Create the Growth-Share Matrix Grid: Create a two-by-two box grid matrix grid. Label the matrix grid with an appropriate title.
- Create Categories: Place Star in the upper left box, Cow in the lower remaining box; Question Mark in the top right box; and Dog in the right box.
Star represents high growth and high market share.
Cow denotes low growth and high market share.
Dog signifies low growth and low market share.
Question Mark signifies high growth and low market share.
- Add Labels: Insert on the bottom left corner of the grid an arrow going upwards and another going to the right.
The top left box is the “High” Growth Rate.
The left box is the “Low” Growth Rate.
The bottom left box is the “High” Growth Rate.
The bottom right box is the “Low” Growth Rate.
- Identify Finances: Identify products or investments fit each category on Matrix and insert where appropriate.
- Generate Conclusions: Use the completed Matrix for decision-making to decide where to focus corporate time, effort, and investment capital.